Latest News
If not managed, nonlinear distortion can cause havoc in satellite links by degrading Bit Error Rate (BER) and generating interference to other signals. To control distortion, satellite ground system RF designers must make early and expensive decisions about sizing amplifiers and planning uplink and downlink chains. Often, system specifications such as Noise Power Ratio (NPR) and Adjacent Channel Interference (ACI) cannot be flowed down to suppliers who characterize their components with simple two-tone intermodulation distortion (IMD) and 1-dB compression (P1dB), so the ability to predict and inter-relate nonlinear behaviors is highly desirable. Because satellite ground station RF systems are generally broadband, they are naturally suited to the quasi-static method for nonlinear analysis, provided that the distortion is memoryless. If that condition holds, it is possible to accurately predict and inter-relate amplitude-to-amplitude distortion (AM-AM), amplitude-to-phase distortion (AM-PM), IMD, two-tone products, NPR, compression, sideband regrowth, and ACI. In this article, we will review the principles of this powerful analysis method, and how to detect and avoid distortion memory.
Linear vs. nonlinear systems
A linear system is one whose transfer function is deterministic (does not change randomly), obeys superposition (signals do not affect each other), and time-invariant. The signal may be distorted, such as by a filter bandpass response, but response to arbitrary combinations of signals is perfectly described by a time-invariant transfer function H(s). Linear systems with waves can be described by a transfer function for each combination of forward and reverse wave(s) at all ports (i.e., S-parameters). Passive components (cables, filters, circulators) and active components (amplifiers, mixers) operating at lower signal power levels are generally approximately linear.
Any system that violates any of these criteria is nonlinear. For example, if the presence of a large signal causes the gain to another signal to vary (intermodulation), then the system has violated superposition. If new frequency components are generated in the system, then the system is nonlinear. If the gain response to the sudden presence of a large signal varies with time, the system is nonlinear.
Characterization and analysis of nonlinear distortion is extremely complex. There is no equivalent to the complex transfer function for linear systems, H(s) = Y(s)/X(s), which elegantly and completely describes the response Y to any possible set of input signals X.
Yet, many satellite systems are limited by nonlinear performance, usually in the HPA of the uplink chain or in the transponder. As system engineers, we need tools to predict, at least approximately, nonlinear effects.
Weakly nonlinear systems
The behavior of any real system approaches linear as signal amplitude approaches zero. In the “small signal” region (up to roughly 6-10 dB below the compression or saturation point):
- The linear transfer function (small-signal gain and phase response) closely predicts the output response to the input signal.
- The real-time transfer function Vout(t)/Vin(t) can be well approximated by a polynomial expression with a modest number of terms, and the first three terms dominate. The second-order term causes waveform asymmetry and thus harmonics. The third-order term causes in-band intermodulation products.
- Intermodulation product levels in dB follow the main signal levels at a 3:1 ratio, and if extrapolated, intersect at a constant third-order intercept point, IP3. (Note that here “third order” refers to the frequency combination, e.g., 2f1 – f2, not the polynomial order).
- Other nonlinear metrics will track the 3:1 slope. For example, NPR will be about 8 dB below the two-tone C-I.
Downlink systems should be designed with sufficient headroom to allow these approximations to work well. Uplink systems, however, must go beyond these limits to be cost effective.
Strongly nonlinear systems
In the large-signal region, most of the above approximations do not work well.
- Gain is compressed — or may even expand. Average power of a modulated signal may be different than that of a CW signal at the same input level. PAPR may be altered. Signal gain and phase may change dynamically during the waveform. In saturation, amplitude may be forced constant while phase is retained, but perhaps distorted.
- A high-order polynomial may be needed to describe the real-time voltage transfer function (consider the sharp corners of a simple clipping op-amp).
- IMD products may vary wildly with level. In fact, two-tone products can even be nulled at certain levels and actually get worse as signal level is reduced.
- The 3:1 rule does not hold and there is no fixed IP3.
- The relationship between nonlinear metrics, such as IMD, NPR, ACPR, becomes very complex and cannot be predicted from simple performance parameters such as P1dB and Psat.
Band-limited nonlinear distortion
Satellite uplink systems generally operate over bandwidths of less than 10 percent of the carrier frequency and harmonics are managed with filtering. That’s a huge help because it means we can analyze the complex modulation wave for m of the signal, not the entire modulated carrier waveform.
Complex modulation
Any (yes, any!) waveform or combination of waveforms can be represented by:
s(t) = |m(t)|. cos( ω0 t + ∠m(t))
where s(t) is real and represents the signal’s instantaneous voltage at time t, ω0 is an arbitrary carrier frequency, and m(t) is complex and represents the modulation vector at time t. (Note: bold notation indicates a complex value). The Cartesian representation of m(t) = I(t) + jQ(t) is less convenient than the polar representation, i.e., the instantaneous magnitude (power) and phase.
For example, consider a two-tone test signal with one tone at frequency ω0 and the other at frequency offset by ωs. Both have amplitude a.
s(t) = a cos[ω0 t] + a cos[ (ω0+ ωs)t ]
= m(t). cos(ω0 t)
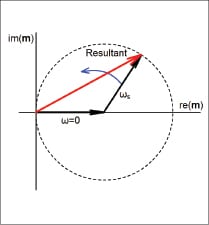
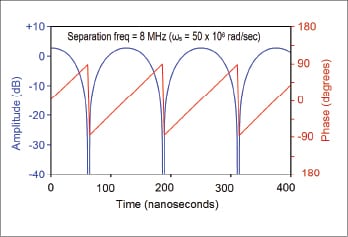
This can be visualized by considering how m would be plotted on a complex plane as a fixed vector summed with a rotating vector, as illustrated in Figure 1. If you plot the magnitude of m (in dB) and phase of m (in degrees) vs. time, you get a plot like Figure 2.
Figure 2 is interesting because it shows why a two-tone test signal has a peak-to-average power ratio of 3 dB above the average power (dashed line), and the waveform has a pulse-like behavior over a wide dynamic range. That makes it potentially useful, or perhaps inappropriate, as a test signal. But in general, the concept of representing signals as a CW carrier with complex, time-dependent modulation can be very illuminating.
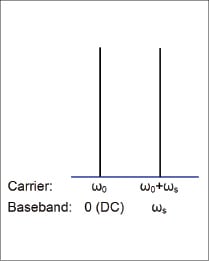
Using complex modulation has another benefit: spectrum visualization. The modulation is simply upconverted by the virtual carrier. In our two-tone example, the tone at ω0 is represented by a DC term and the other tone is represented by a sine wave at frequency ωs, as illustrated in Figure 3.
Nonlinear Transfer Curves
Under the memoryless distortion approximation, which we will define later, the complex envelope mo(t) at the output of the device at time instant t depends only on the transfer curves and the input envelope mi(t) at that instant, according to the following relationships:
20 log|mout(t)| = Pout(t) = A{Pin(t)} and ∠mout(t) = ∠min(t)+ φ{Pin}
where:
A{Pin} = power input-to-output transfer curve (AM-AM curve)
φ{Pin} = phase input-to-output transfer curve (AM-PM curve)
min(t) = complex modulation of the input signal at time t
mout(t) = complex modulation of the output signal at time t
Pin(t) = input power at time t
Pout(t) = output power at time t
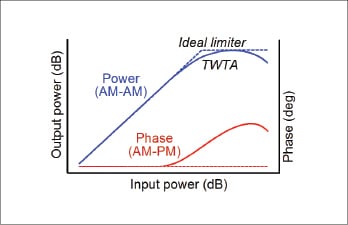
Example transfer curves for a TWTA amplifier are shown in Figure 4.
In other words, the instantaneous output power depends only on the instantaneous input power, following the AM-AM curve, and does not depend on the history of the signal. Similarly, the device adds an instantaneous phase shift to the input signal, which depends only on the input power, following the AM-PM curve. The gain and phase shift simply respond instantly along the curves as the input level varies. If this relationship remains true no matter how fast or slowly the input signal changes, the nonlinear system is said to have no distortion memory, or to be memoryless. The system can therefore be characterized its AM-AM/AM-PM transfer curves (not to be confused with the linear transfer function).
Of course, there will always be some distortion memory, but if it is negligible within a defined bandwidth around a defined nominal center frequency, analysis and prediction of the nonlinear response of a system is relatively simple and quite accurate.
Get the latest Via Satellite news!
Subscribe Now


